Visualizing cyber threats framework

Re-designing MITRE ATT&CK for ServiceNow
We aimed to enhance the usability and effectiveness of the MITRE ATT&CK heat map visualisation in ServiceNow Security Incident Response application, helping security analysts, threat intelligence professionals, and leaders gain better insights and make data-driven decisions.
But, what is MITRE ATT&CK®?
Think of MITRE ATT&CK as a periodic table of cyber threats. It categorizes known attack behaviors (like credential dumping, lateral movement, data exfiltration) across different threat stages. Security teams use this as it categorizes threats into Tactics (what the attacker is trying to achieve), Techniques (how they achieve it), and Sub-techniques (specific implementations).
Team: Worked with 1 product manger and 4 engineers.
Skills: Visual Design, Interaction Design, Usability & Accessibility
Users: Security Analysts, Threat Intelligence Teams
Impact: Post-release, we saw a 40% reduction in manual effort for threat classification and mapping, making workflows more efficient. The accuracy of attack technique identification improved by 23%, enhancing proactive defense. With these improvements, analysts increasingly relied on in-platform MITRE ATT&CK insights, leading to higher adoption and reducing the need for external references.

Research & Analysis
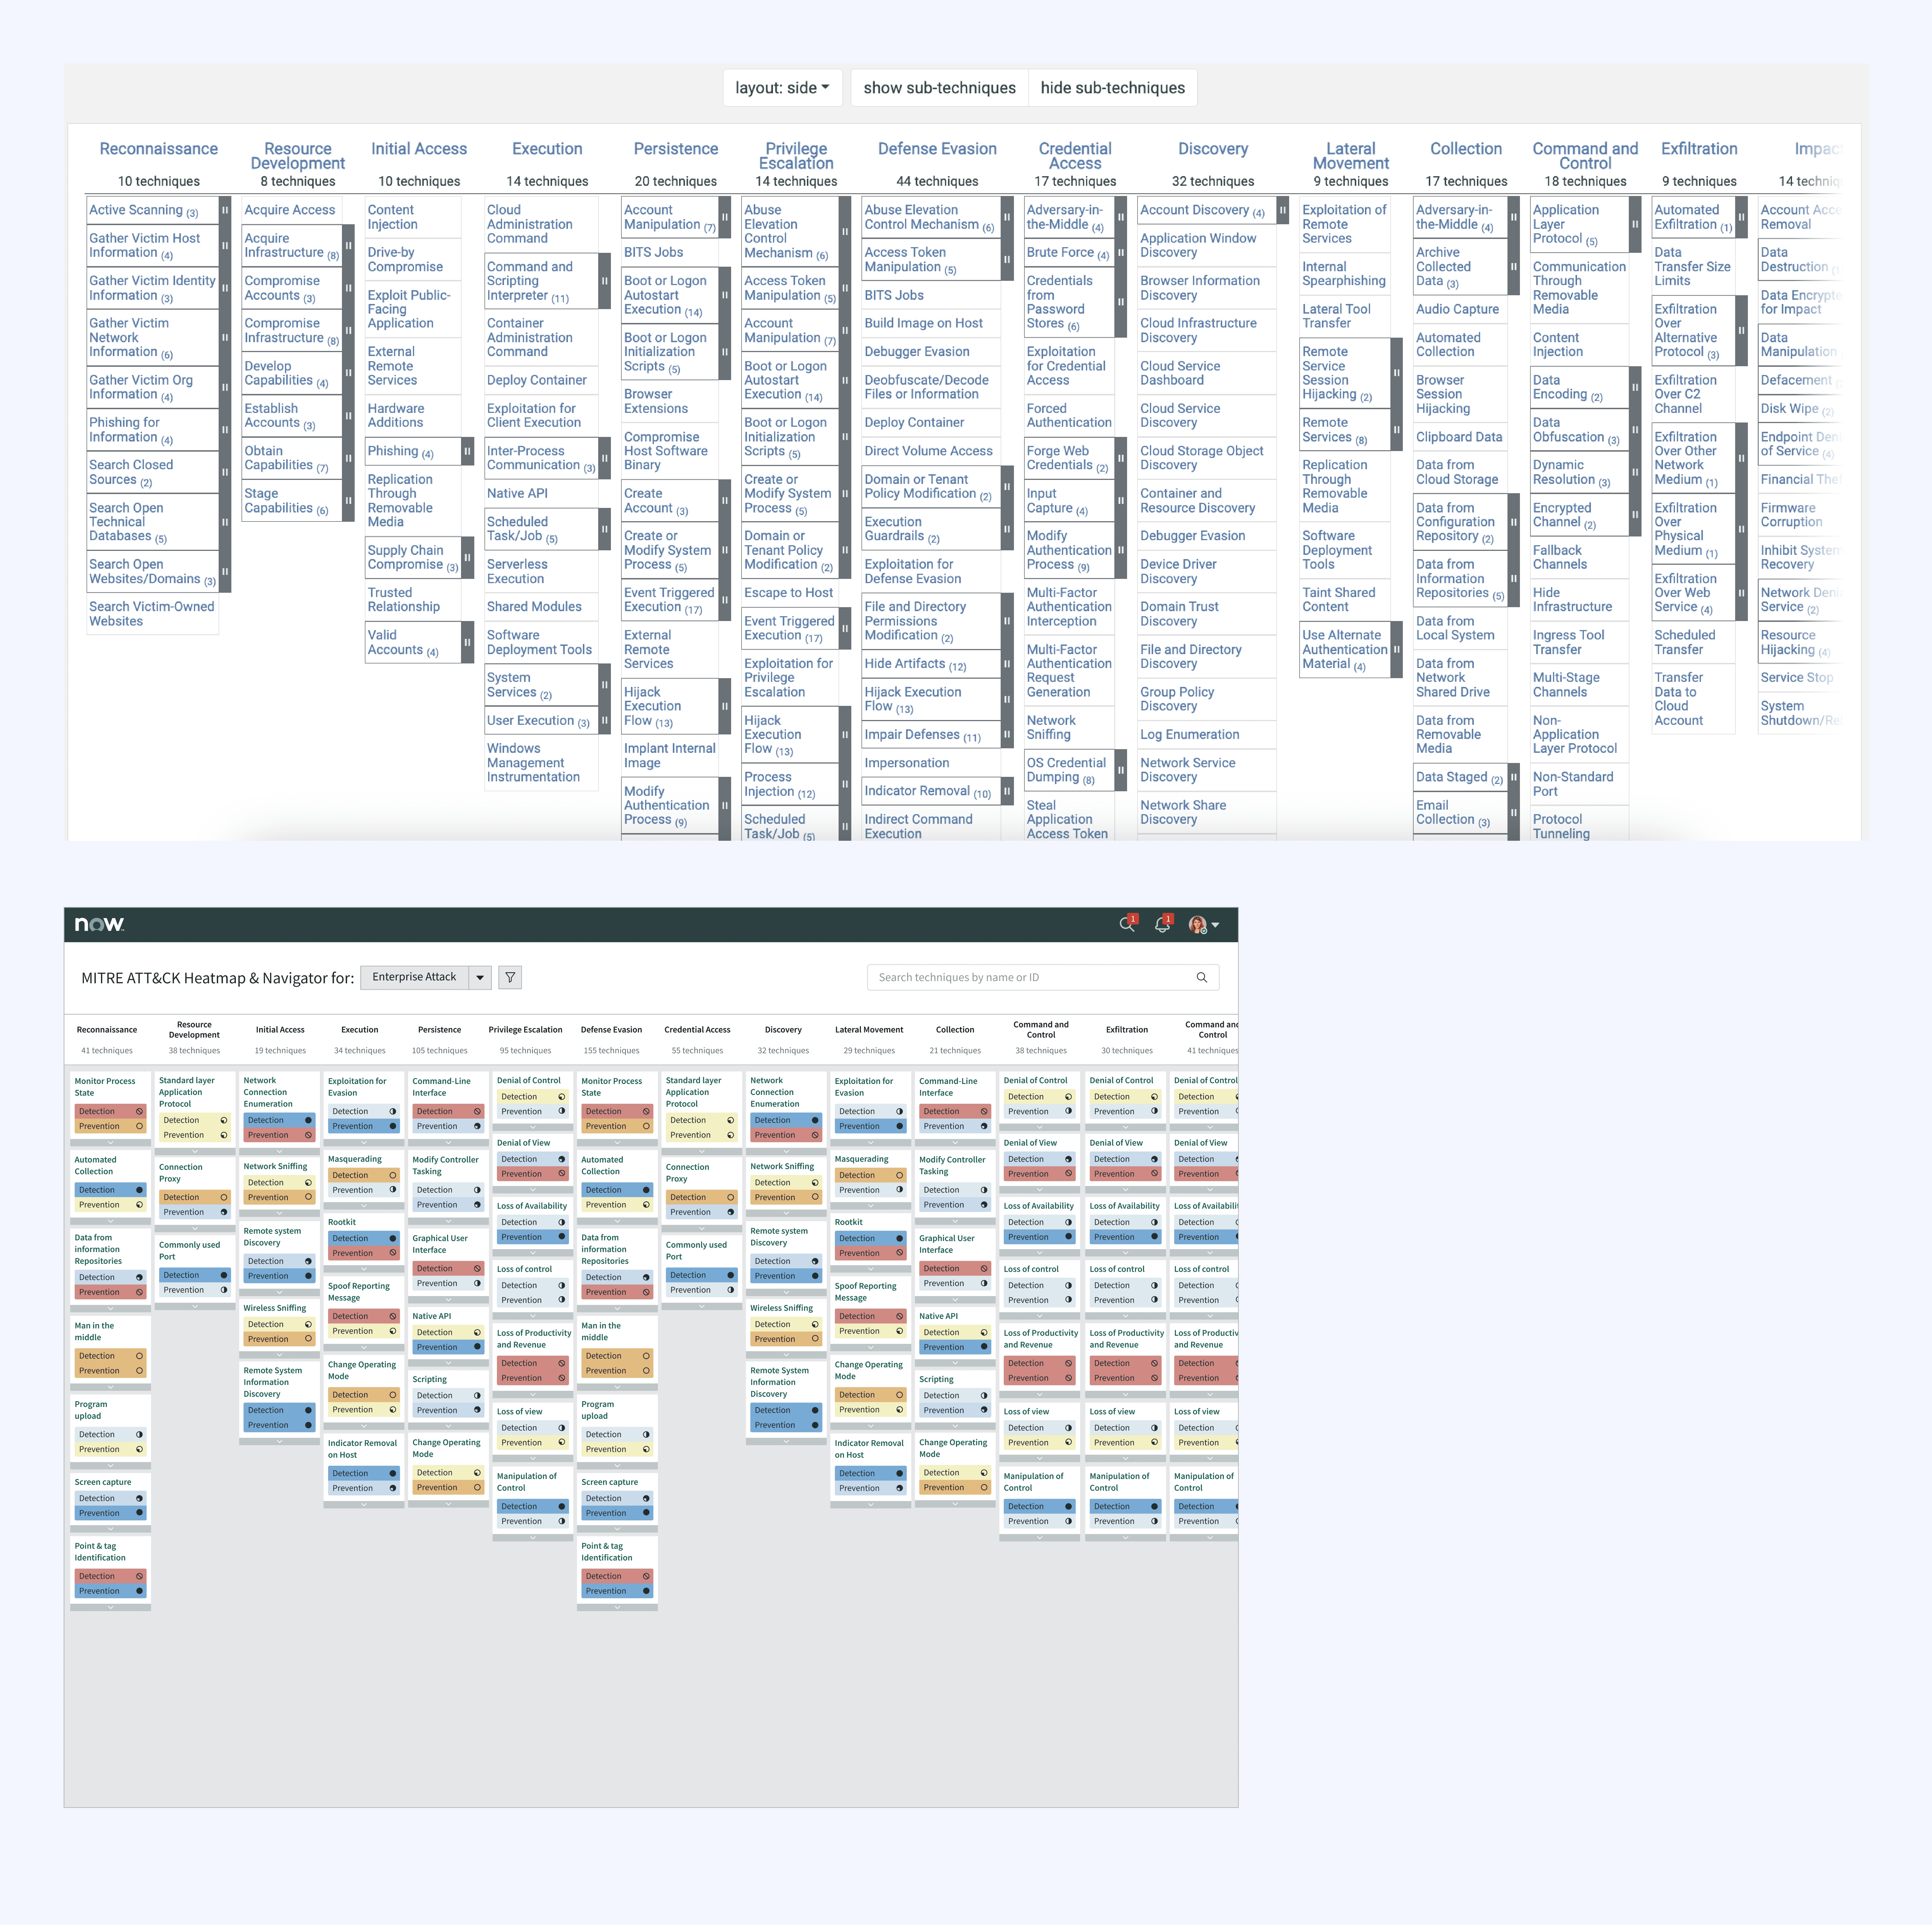
The current MITRE ATT&CK framework visualization while comprehensive, presents challenges in usability, navigation, and cognitive load. As cybersecurity threats evolve, security professionals require an intuitive, efficient, and accessible tool to analyze and apply threat intelligence effectively.
The initial requirement is to migrate the existing framework without altering core functionality. However, rather than just a direct transition, we see this as an opportunity to enhance visual consistency, improve usability, and future-proof the experience.
By redesigning MITRE ATT&CK with the ServiceNow Design System, we aim to:
• Standardize UI components for consistency and maintainability,
• Improve navigation and readability by leveraging ServiceNow’s structured layouts and typography
• Enhance accessibility and responsiveness to support diverse user needs
"This redesign will transform MITRE ATT&CK from a static reference tool into a dynamic, adaptable experience that will help security professionals to act with speed and clarity"
Listening to users
We reached out to the internal security team within ServiceNow to understand key issues. Through these discussions, we discovered that navigating and interpreting attack techniques and coverage is a major pain point, often leading to inefficiencies in threat analysis and decision-making.
Looking Inwards
We ran a comprehensive experience review of our current experience across the triad & design team.
By analysing the current experience and listening to users, we listed Key jobs users will be doing and problem breakdown.
1) Exploring Attack Techniques
Security analysts research tactics, techniques, and sub-techniques, often cross-referencing multiple categories to assess threats
2) Evaluating Security Coverage
Teams map defenses to ATT&CK to find gaps and improve detection, requiring clear visualization and quick access to relevant techniques.
Problem Breakdown
Not Aligned with ServiceNow Design
The UI doesn’t follow ServiceNow’s design system, making it hard to update, scale, and integrate with the existing security products.
High Cognitive Load
Dense, text-heavy layout makes scanning difficult, with too much scrolling and inconsistent formatting.
Unstructured Information
Techniques and sub-techniques lack clear grouping, forcing users to manually search for relevant details.
Slow & Inefficient Workflows
Too many clicks to access key details. No quick filters, overlays, or structured navigation, leading to frustration.
Explore, Iterate, Test, Repeat
Job to be done
1) Exploring Attack Techniques
Job to be done
2) Evaluating and visualising security Coverage
Coverage refers to the degree to which an organisation has visibility or defense mechanisms in place against specific adversarial behaviour's, outlined as techniques under ATT&CK's structured matrix of tactics and techniques.
The original navigator itself does not prescribe fixed values for coverage. Instead, it allows organisation's to input their own data, color-code them within the matrix. The most common convention we observed across teams was the use of a Red → Yellow → Green gradient to signify levels of detection or prevention:

While effective at a glance, this basic gradient fell short in granularity and scalability, especially for organizations managing complex infrastructures or working with multiple detection sources.
To improve clarity and accommodate diverse organizational needs, I explored multiple visual variations of the coverage model within the Navigator:
Heatmap-Based Coverage Visualization
“Security isn’t binary, it’s incremental. The heat-map helped us show progress, not just a pass/fail.” -Security Analyst, Internal team member at ServiceNow
We introduced a 0–100% heatmap scale, allowing teams to express prevention or detection frequency numerically.

👍🏾 Things Working Well
Logical color gradient from excellent (green) to none (red).
Minimal, clean UI as it is not overwhelming despite multiple data points.
👎🏾 Things that need work
The use of dots meters makes it look like a linear progress indicator, which it is not.
Some colors (blue, purple, teal) are visually too similar.
Detection and Prevention dots can feel too small or hard to distinguish quickly.
Color-only encoding still limits interpretability for colorblind users(Not accessible).
Lacks fast scanning for outliers (what’s missing coverage?).
👎🏾 Things that need work
The progress meters still looks like a linear progress indicator, which it is not.
Color-only encoding still limits interpretability for colorblind users(Not accessible).
Lacks fast scanning for outliers (what’s missing coverage?).


👍🏾 Things Working Well
Dual encoding (color + icon) greatly improves accessibility and scannability.
Icons are semantically appropriate and support quick interpretation.
Color legend is clear, with labels ranges aiding understanding.
Consistent structure across cards supports scanability.
👎🏾 Things that need work
Tooltip with full description would enhance clarity for each level on the legend.
Using bold font weight for Detection and Prevention can help more


Highlights:
USER JOB: Navigating threat behaviors
DESIGN PRINCIPLE: TASK SIMPLIFICATION
Making sense of attack techniques
Security analysts needed to understand adversary behaviors (tactics, techniques, sub-techniques) across the MITRE ATT&CK framework. We redesigned the experience to reduce cognitive overload and improve readability by aligning visuals to ServiceNow’s design system. Structured layouts, refined typography, and better grouping made it easier to scan and explore data without getting lost.
USER JOB: Evaluate detection and prevention coverage
DESIGN PRINCIPLE: INFORMATION SCANNABILITY
Heatmap-based coverage redesign
Moved from basic Red → Yellow → Green gradient to a more granular 0–100% heatmap scale, allowing teams to track incremental progress. However, initial visualizations using colored dots appeared as linear progress indicators and didn’t scale well for accessibility.
USER JOB: Quickly scan for gaps
DESIGN PRINCIPLE: ACCESSIBILITY + CLARITY
Dual-encoding for better understanding
We introduced a dual encoding system (color + icon) to support colorblind users and improve visual parsing. Each coverage level was associated with a distinct icon and color, improving comprehension at a glance. Analysts could now more easily identify where coverage was strong or missing.
Impact:
✅ 40% less manual effort in threat mapping
✅ 23% better technique identification
✅ Higher adoption, fewer external references used
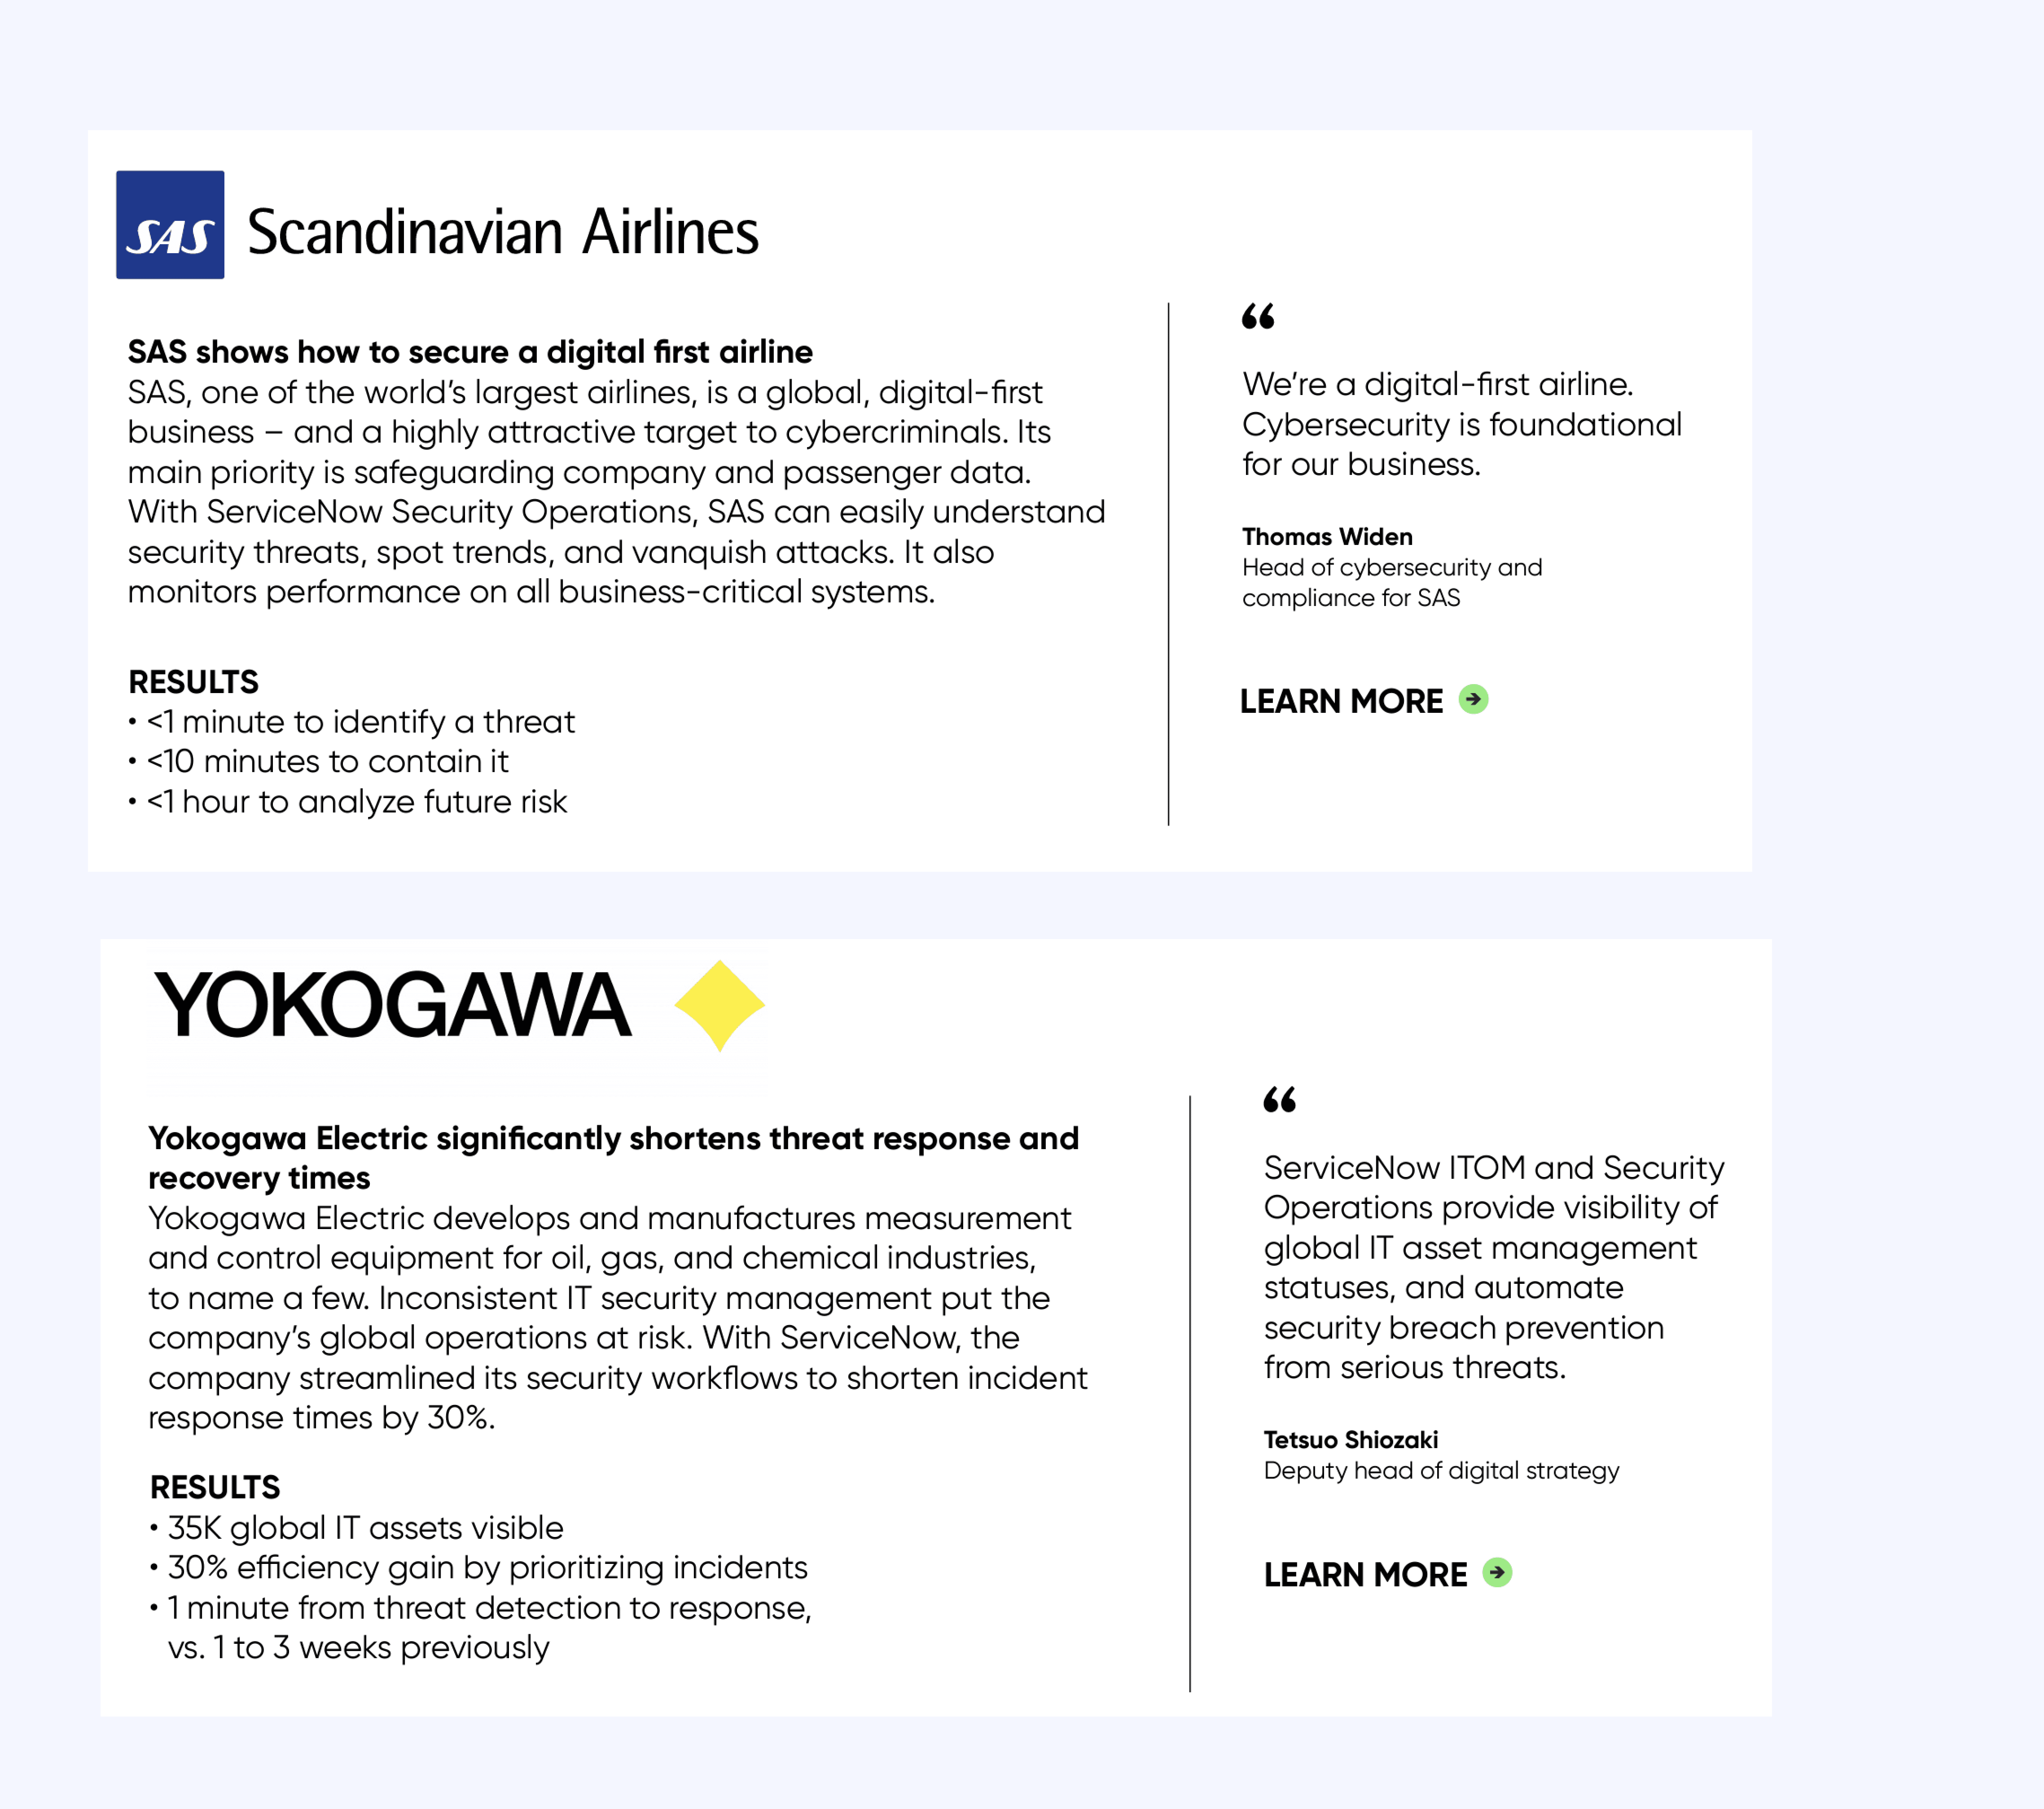
ServiceNow Security Tool Adoption (Industry Examples)
References
https://www.servicenow.com/products/security-operations.html
https://www.servicenow.com/blogs/2021/security-transformation-with-servicenow.html
Re-designing MITRE ATT&CK for ServiceNow
We aimed to enhance the usability and effectiveness of the MITRE ATT&CK heat map visualisation in ServiceNow Security Incident Response application, helping security analysts, threat intelligence professionals, and leaders gain better insights and make data-driven decisions.
But, what is MITRE ATT&CK®?
Think of MITRE ATT&CK as a periodic table of cyber threats. It categorizes known attack behaviors (like credential dumping, lateral movement, data exfiltration) across different threat stages. Security teams use this as it categorizes threats into Tactics (what the attacker is trying to achieve), Techniques (how they achieve it), and Sub-techniques (specific implementations).
Team: Worked with 1 product manger and 4 engineers.
Skills: Visual Design, Interaction Design, Usability & Accessibility
Users: Security Analysts, Threat Intelligence Teams
Impact: Post-release, we saw a 40% reduction in manual effort for threat classification and mapping, making workflows more efficient. The accuracy of attack technique identification improved by 23%, enhancing proactive defense. With these improvements, analysts increasingly relied on in-platform MITRE ATT&CK insights, leading to higher adoption and reducing the need for external references.
Research & Analysis
The current MITRE ATT&CK framework visualization while comprehensive, presents challenges in usability, navigation, and cognitive load. As cybersecurity threats evolve, security professionals require an intuitive, efficient, and accessible tool to analyze and apply threat intelligence effectively.
The initial requirement is to migrate the existing framework without altering core functionality. However, rather than just a direct transition, we see this as an opportunity to enhance visual consistency, improve usability, and future-proof the experience.
By redesigning MITRE ATT&CK with the ServiceNow Design System, we aim to:
• Standardize UI components for consistency and maintainability,
• Improve navigation and readability by leveraging ServiceNow’s structured layouts and typography
• Enhance accessibility and responsiveness to support diverse user needs
"This redesign will transform MITRE ATT&CK from a static reference tool into a dynamic, adaptable experience that will help security professionals to act with speed and clarity"
Listening to users
We reached out to the internal security team within ServiceNow to understand key issues. Through these discussions, we discovered that navigating and interpreting attack techniques and coverage is a major pain point, often leading to inefficiencies in threat analysis and decision-making.
Looking Inwards
We ran a comprehensive experience review of our current experience across the triad & design team.
By analysing the current experience and listening to users, we listed Key jobs users will be doing and problem breakdown.
1) Exploring Attack Techniques
Security analysts research tactics, techniques, and sub-techniques, often cross-referencing multiple categories to assess threats
2) Evaluating Security Coverage
Teams map defenses to ATT&CK to find gaps and improve detection, requiring clear visualization and quick access to relevant techniques.
Problem Breakdown
Not Aligned with ServiceNow Design
The UI doesn’t follow ServiceNow’s design system, making it hard to update, scale, and integrate with the existing security products.
High Cognitive Load
Dense, text-heavy layout makes scanning difficult, with too much scrolling and inconsistent formatting.
Unstructured Information
Techniques and sub-techniques lack clear grouping, forcing users to manually search for relevant details.
Slow & Inefficient Workflows
Too many clicks to access key details. No quick filters, overlays, or structured navigation, leading to frustration.
Explore, Iterate, Test, Repeat
Job to be done
1) Exploring Attack Techniques
Job to be done
2) Evaluating and visualising security Coverage
Coverage refers to the degree to which an organisation has visibility or defense mechanisms in place against specific adversarial behaviour's, outlined as techniques under ATT&CK's structured matrix of tactics and techniques.
The original navigator itself does not prescribe fixed values for coverage. Instead, it allows organisation's to input their own data, color-code them within the matrix. The most common convention we observed across teams was the use of a Red → Yellow → Green gradient to signify levels of detection or prevention:
While effective at a glance, this basic gradient fell short in granularity and scalability, especially for organizations managing complex infrastructures or working with multiple detection sources.
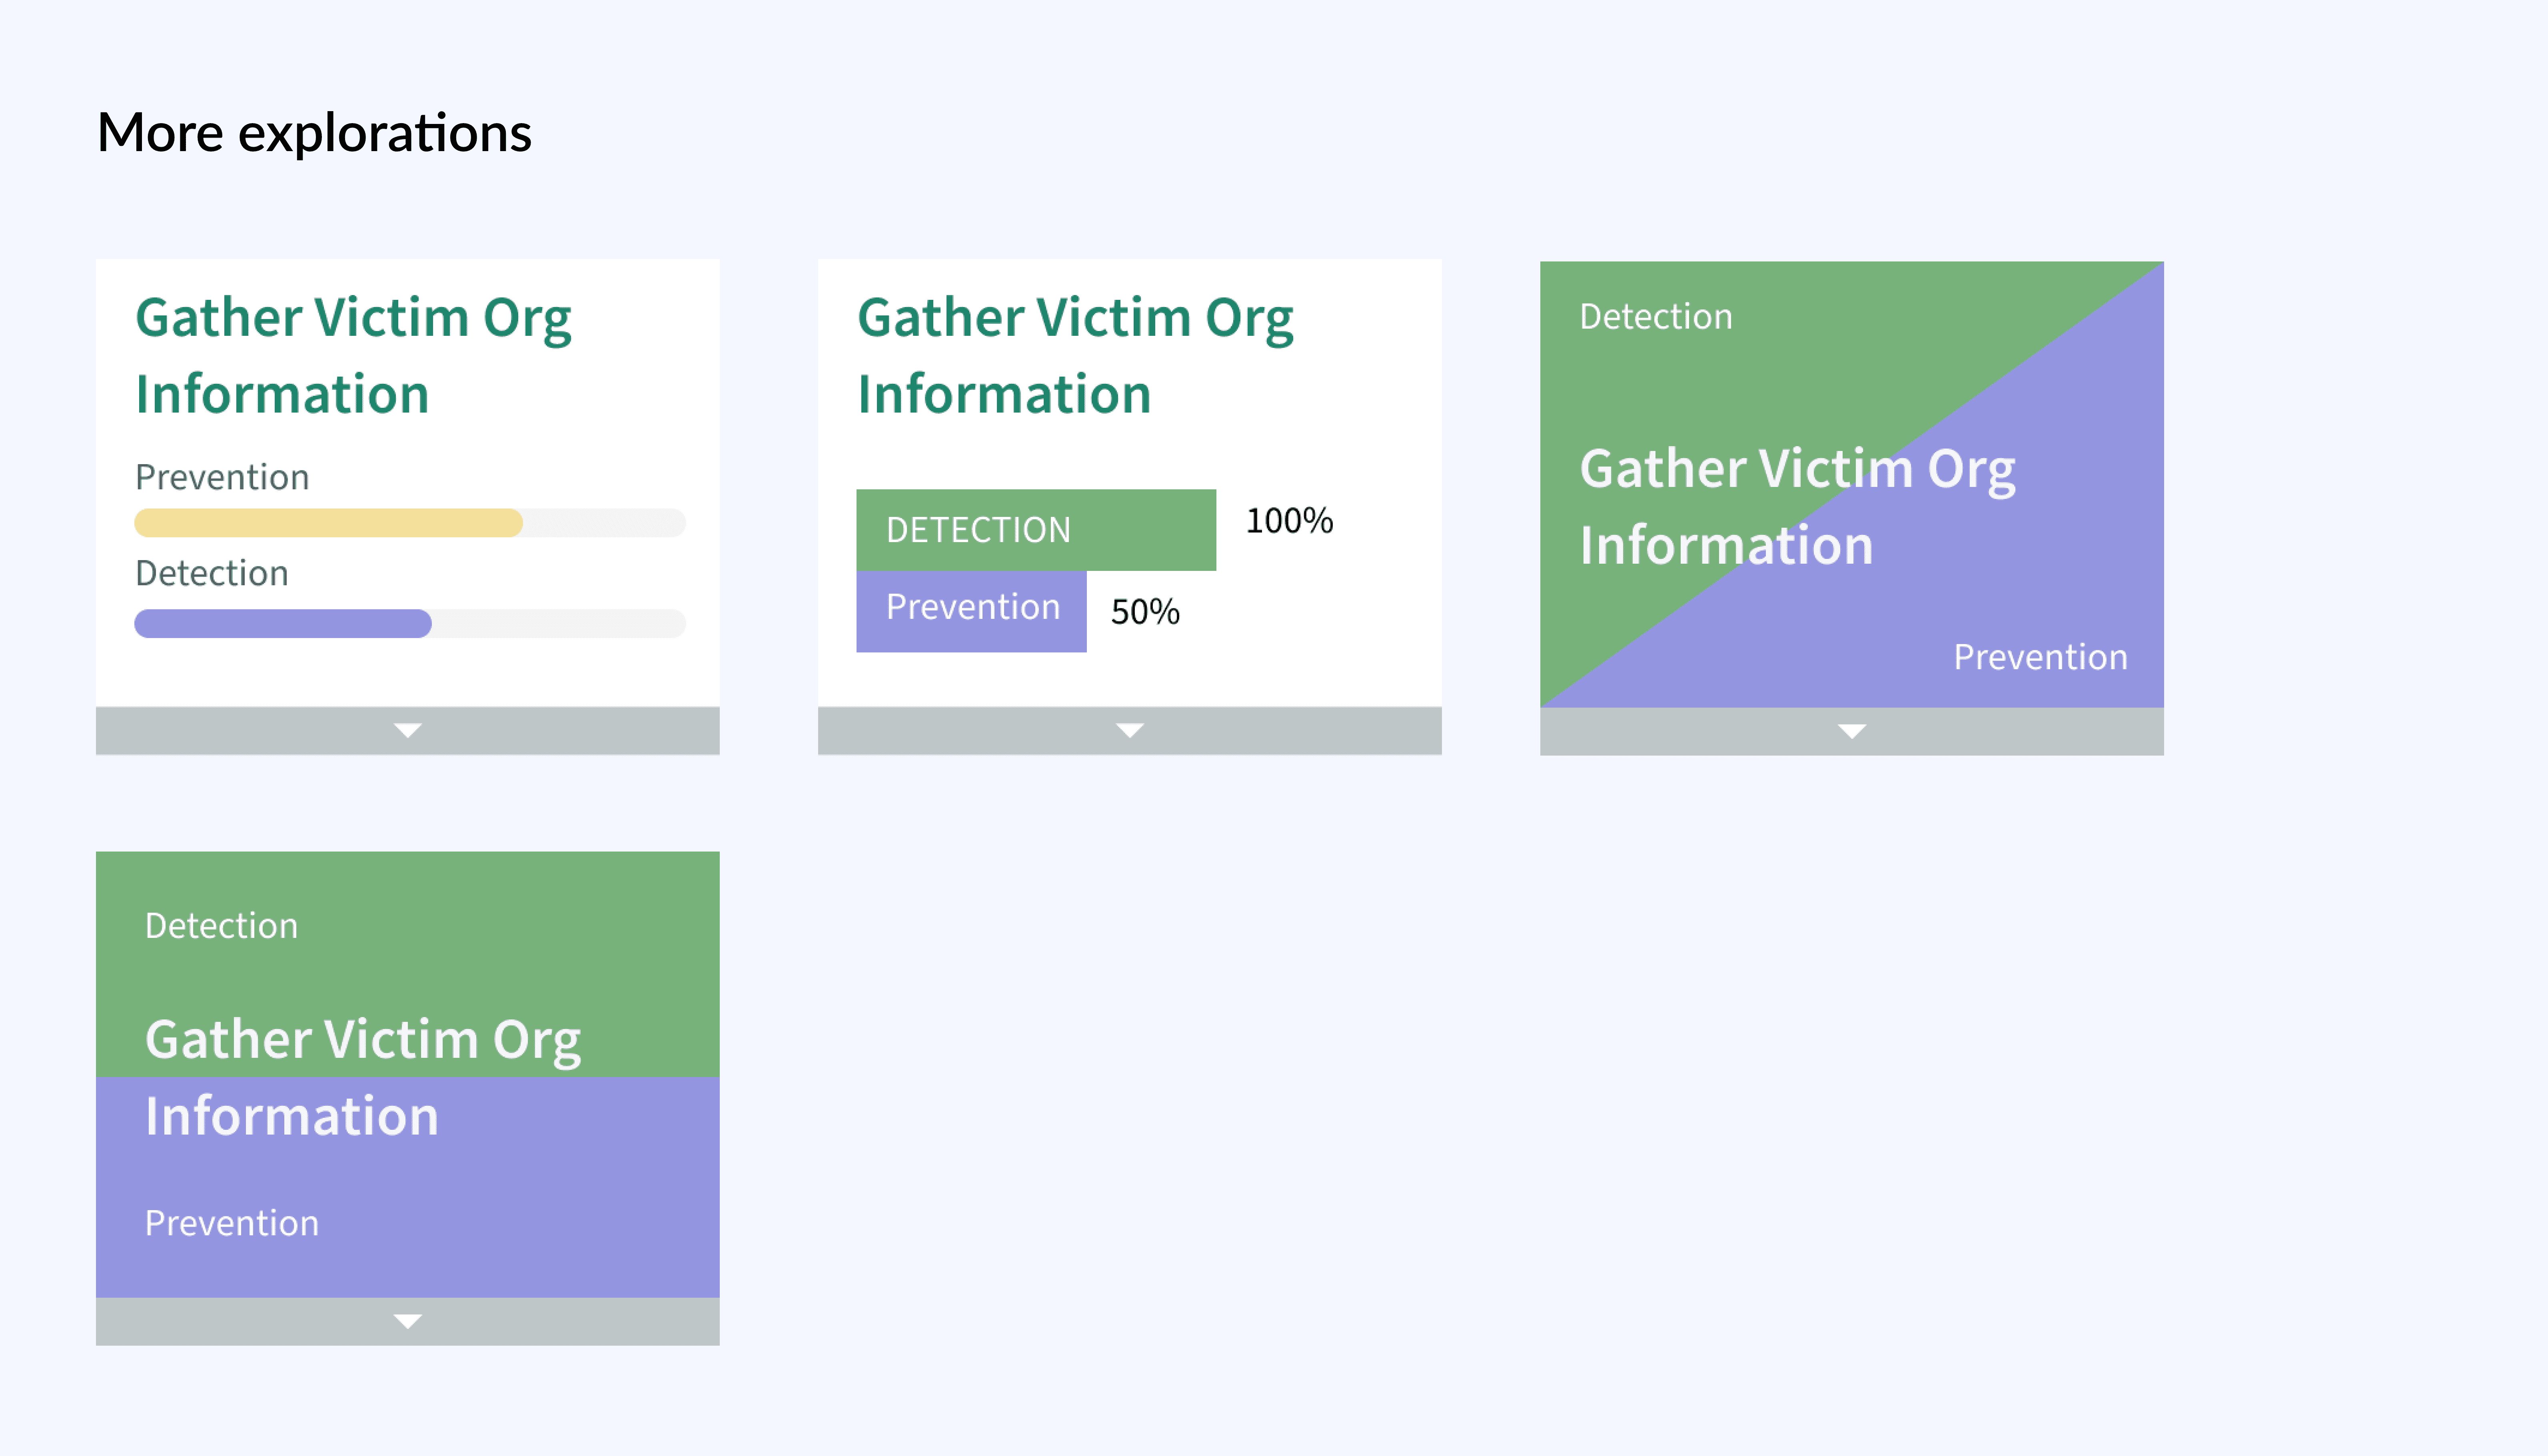
To improve clarity and accommodate diverse organizational needs, I explored multiple visual variations of the coverage model within the Navigator:
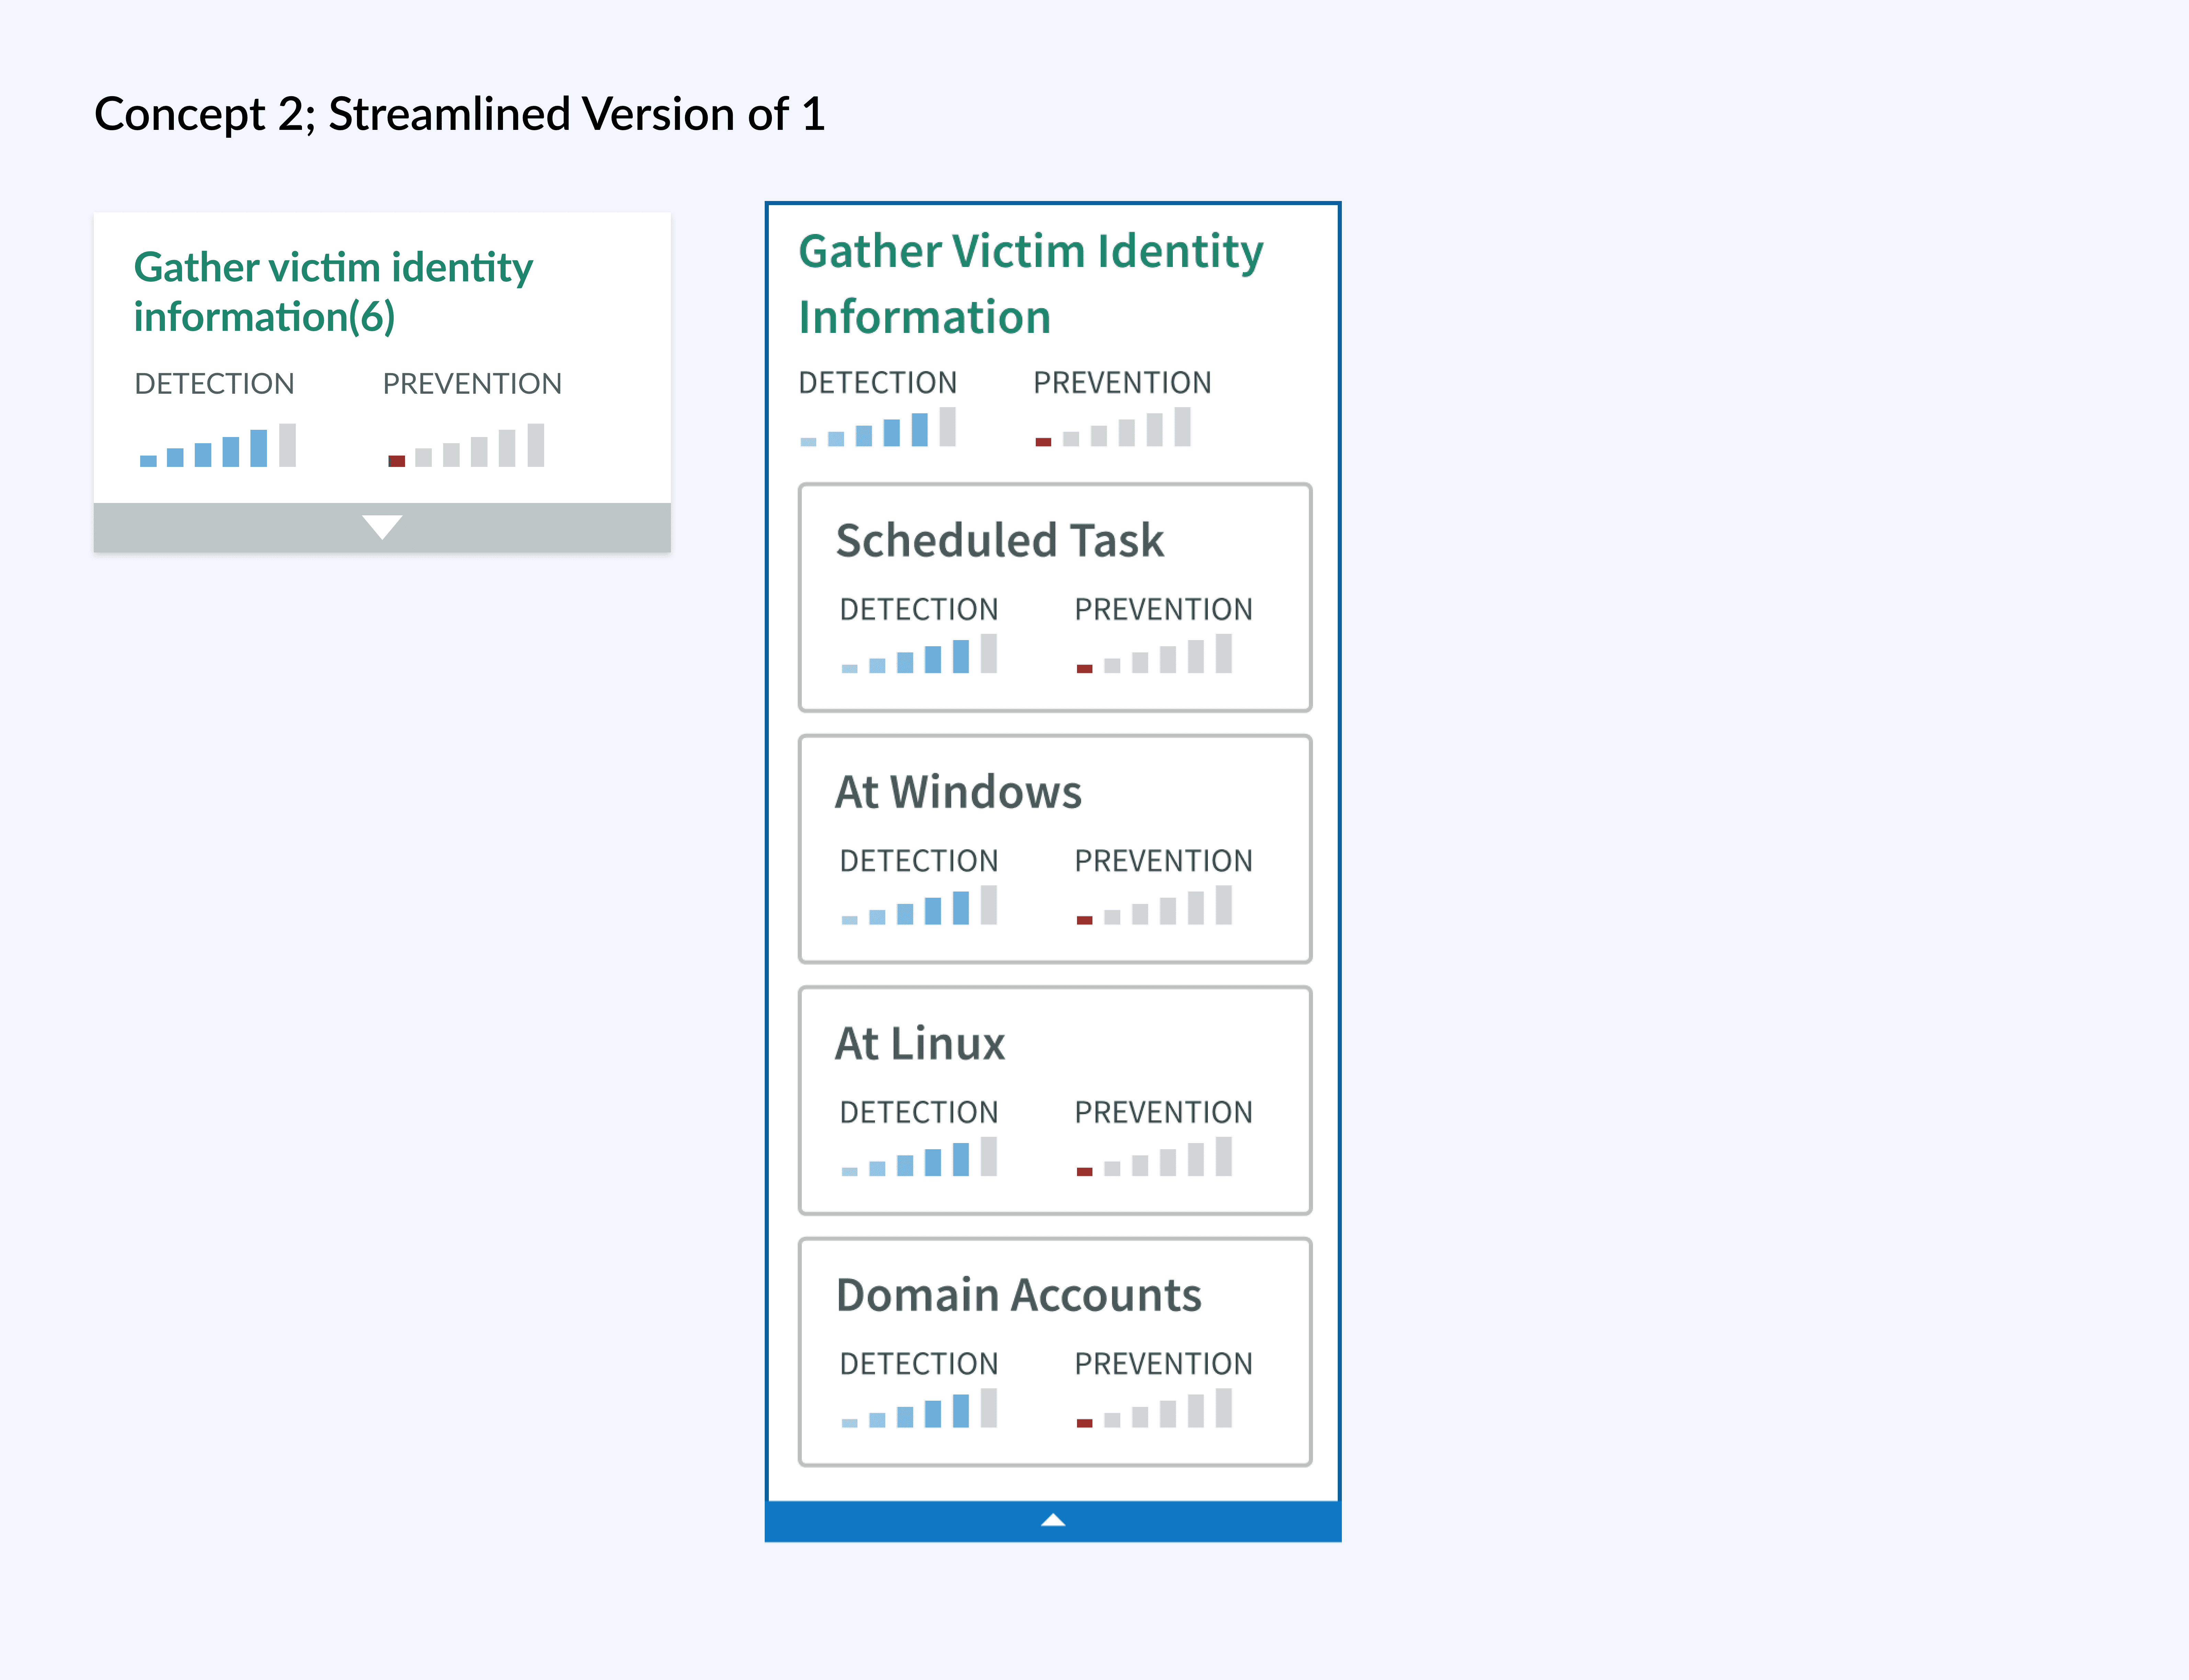
Heatmap-Based Coverage Visualization
“Security isn’t binary, it’s incremental. The heat-map helped us show progress, not just a pass/fail.” -Security Analyst, Internal team member at ServiceNow
We introduced a 0–100% heatmap scale, allowing teams to express prevention or detection frequency numerically.
👍🏾 Things Working Well
Logical color gradient from excellent (green) to none (red).
Minimal, clean UI as it is not overwhelming despite multiple data points.
👎🏾 Things that need work
The use of dots meters makes it look like a linear progress indicator, which it is not.
Some colors (blue, purple, teal) are visually too similar.
Detection and Prevention dots can feel too small or hard to distinguish quickly.
Color-only encoding still limits interpretability for colorblind users(Not accessible).
Lacks fast scanning for outliers (what’s missing coverage?).
👎🏾 Things that need work
The progress meters still looks like a linear progress indicator, which it is not.
Color-only encoding still limits interpretability for colorblind users(Not accessible).
Lacks fast scanning for outliers (what’s missing coverage?).
👍🏾 Things Working Well
Dual encoding (color + icon) greatly improves accessibility and scannability.
Icons are semantically appropriate and support quick interpretation.
Color legend is clear, with labels ranges aiding understanding.
Consistent structure across cards supports scanability.
👎🏾 Things that need work
Tooltip with full description would enhance clarity for each level on the legend.
Using bold font weight for Detection and Prevention can help more
Highlights:
USER JOB: Navigating threat behaviors
DESIGN PRINCIPLE: TASK SIMPLIFICATION
Making sense of attack techniques
Security analysts needed to understand adversary behaviors (tactics, techniques, sub-techniques) across the MITRE ATT&CK framework. We redesigned the experience to reduce cognitive overload and improve readability by aligning visuals to ServiceNow’s design system. Structured layouts, refined typography, and better grouping made it easier to scan and explore data without getting lost.
USER JOB: Evaluate detection and prevention coverage
DESIGN PRINCIPLE: INFORMATION SCANNABILITY
Heatmap-based coverage redesign
Moved from basic Red → Yellow → Green gradient to a more granular 0–100% heatmap scale, allowing teams to track incremental progress. However, initial visualizations using colored dots appeared as linear progress indicators and didn’t scale well for accessibility.
USER JOB: Quickly scan for gaps
DESIGN PRINCIPLE: ACCESSIBILITY + CLARITY
Dual-encoding for better understanding
We introduced a dual encoding system (color + icon) to support colorblind users and improve visual parsing. Each coverage level was associated with a distinct icon and color, improving comprehension at a glance. Analysts could now more easily identify where coverage was strong or missing.
Impact:
✅ 40% less manual effort in threat mapping
✅ 23% better technique identification
✅ Higher adoption, fewer external references used
ServiceNow Security Tool Adoption (Industry Examples)
References
https://www.servicenow.com/products/security-operations.html
https://www.servicenow.com/blogs/2021/security-transformation-with-servicenow.html


